
Product Life Management
Building a net-new experience to track the life-cycle of the products and create data accuracy, improve analyzation opportunities, and encourage proper forecasting calculations.
Project overview
The Direct-to-Consumer team is in need of a Product Life Management tool to better track their product’s life cycles, data integrity, and product forecasting.
Today the team is managing their work and data in make-shift excel files which causes issues with data integrity and creates lots of manual work.
My involvement: Single handedly led discovery, research exercises, requirements gathering, determine project metrics to measure success overtime, work flows mapping
Initiatives & goals
Create a new experience that allows configurations to be stored and accessible in one place for multiple personas to use. The platform supports fluid navigation locating configurations to easily edit and update.
Actions & Process
Led discovery and user research
Analyze and synthesize all user, business, developer feedback
Participate in project strategizing
Results
In progress! I am actively working on this project and existed to share results when we reach the final solution! In the meantime, please explore how I am setting the project up thus far. 🙂
Step 1
Observational testing
The Direct-to-Consumer team, which consists of various Product Analysts and Business Analysts, walked through their file set up, how they use each one, who is manages each, what tasks they do inside, and how they connect to their other files.
It is clear they are experiencing many issues that easily cause simple, but harmful, errors in their manual work. As we’ve continued observational sessions and in discovery, I started and maintain a running list of user challenges and user wants.

Example of how I gather notes during user sessions to synthesize and analyze easily.
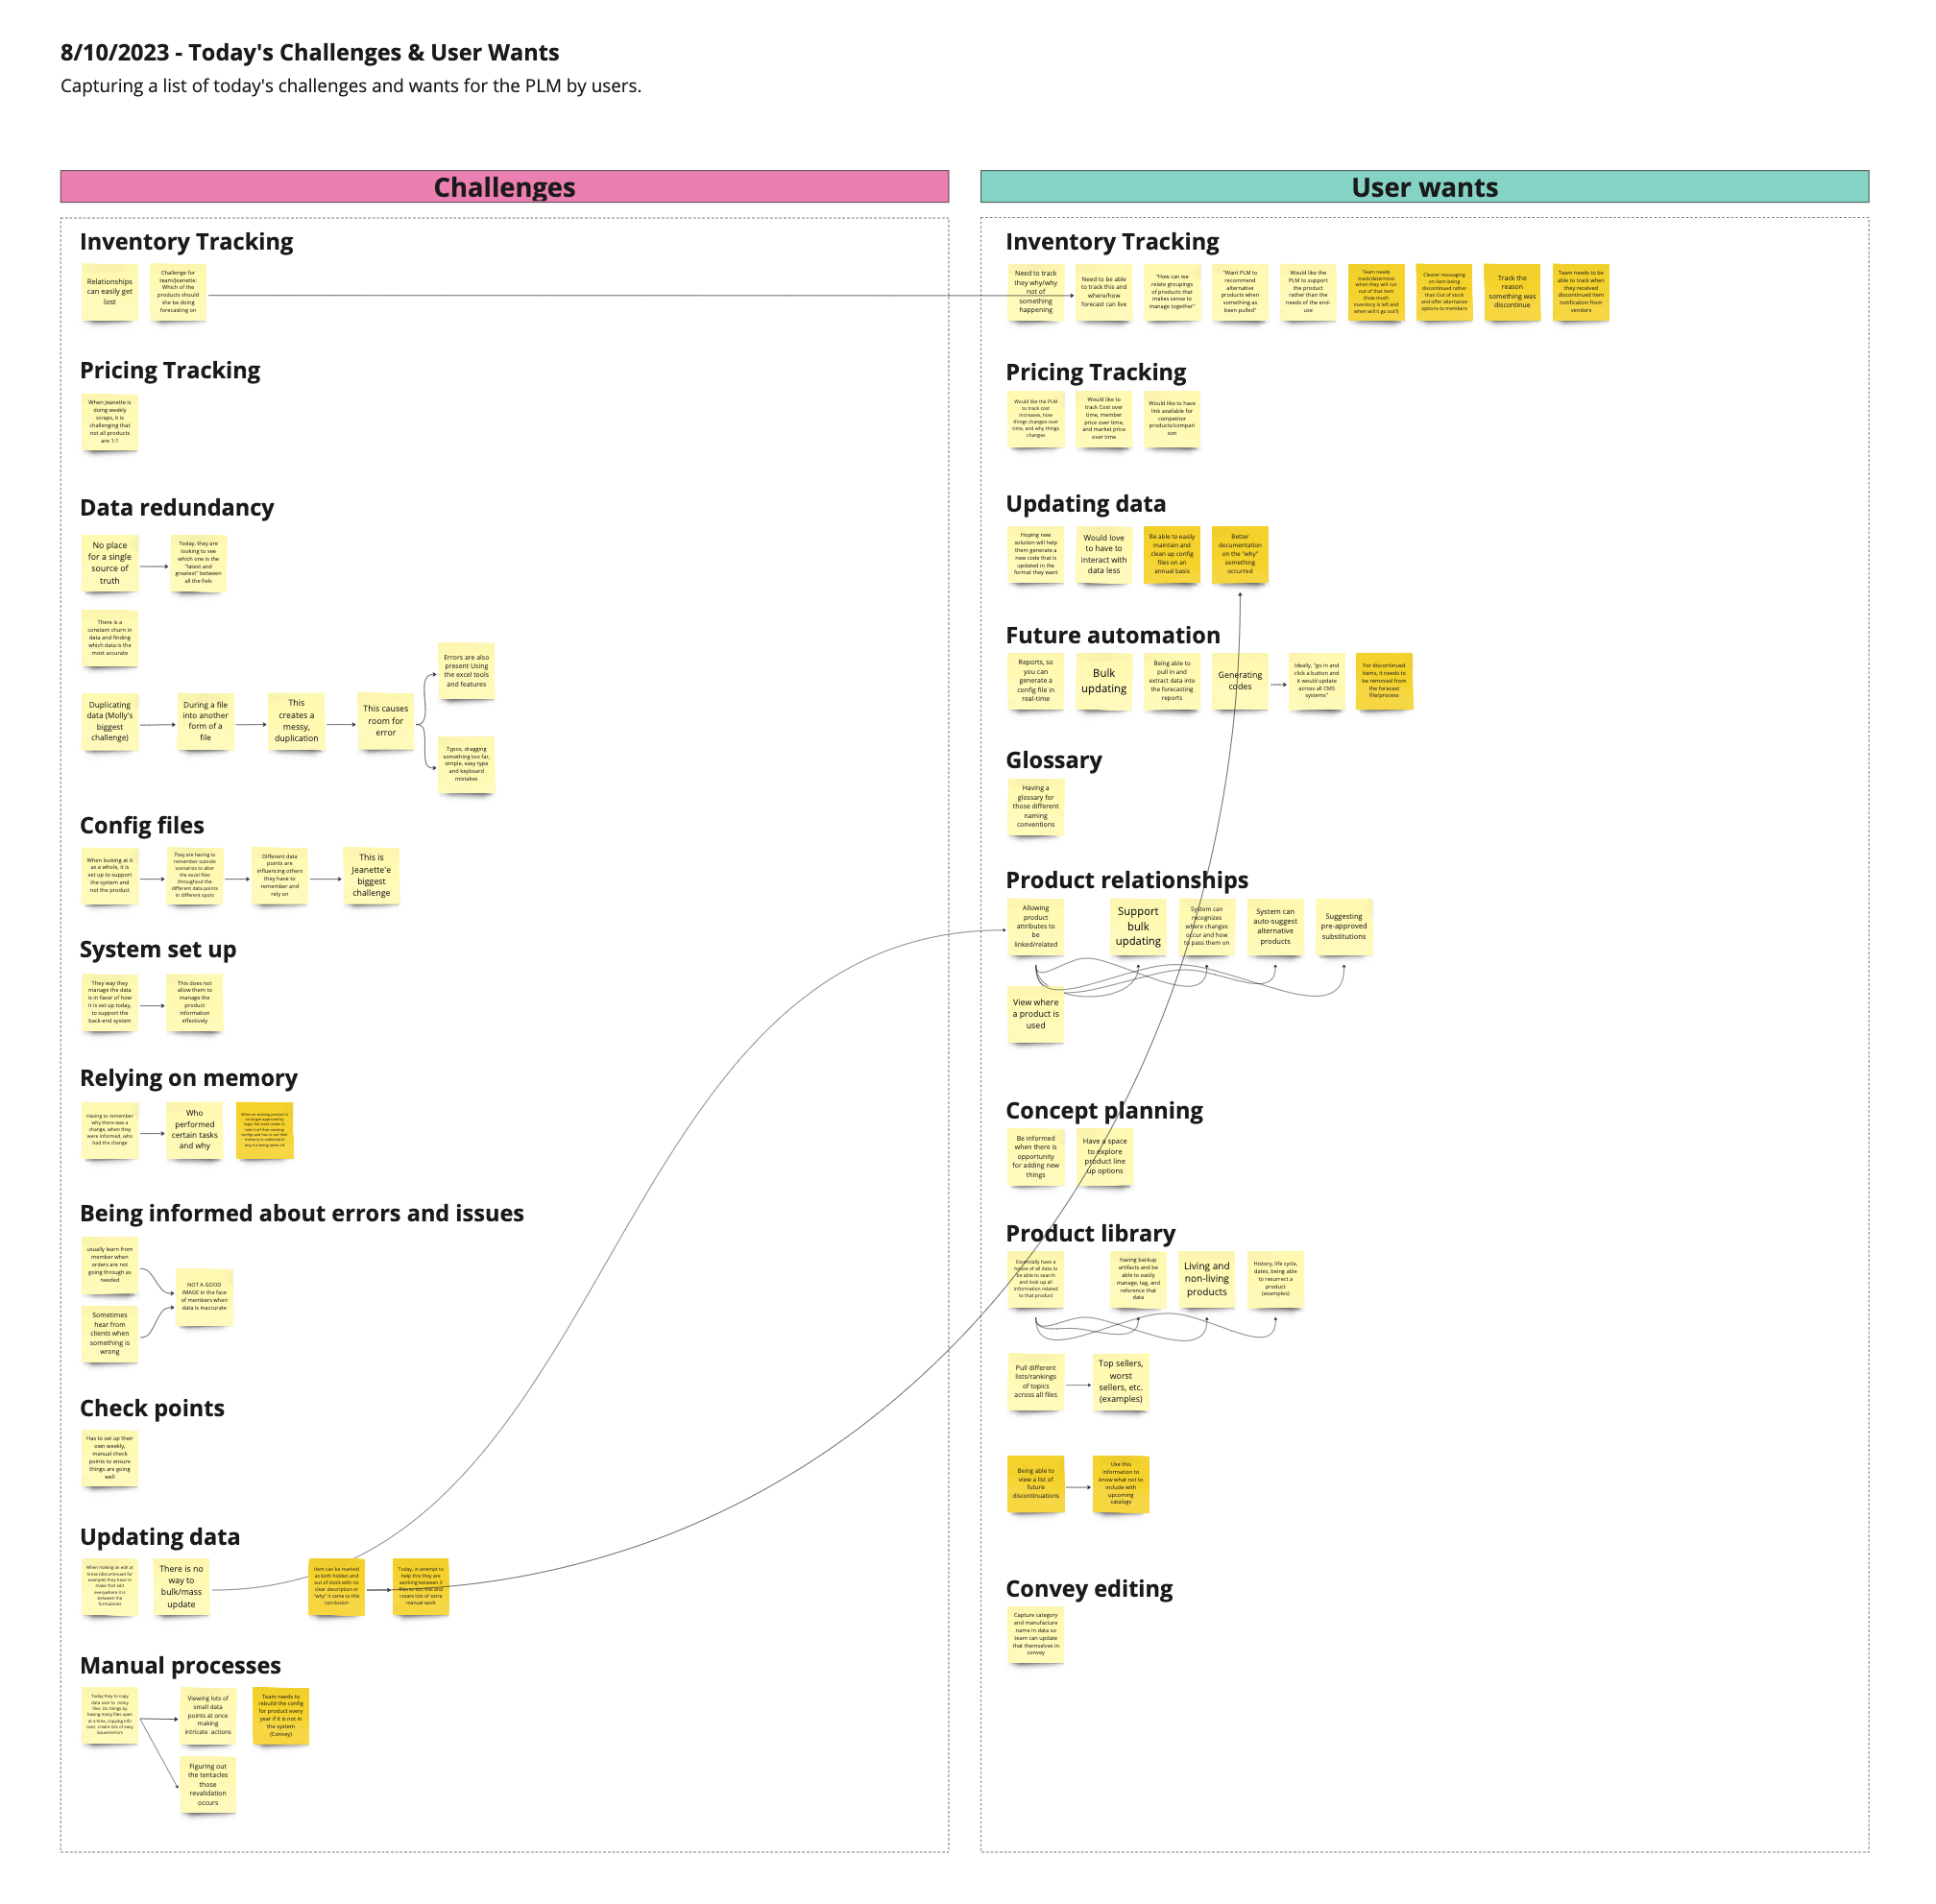
Running list taken from various calls on user pain points and things users mentioned they’d like in their ideal experience.
Step 2
Mapping process flows
From the observational testing, it was clear there has been nothing written down on how the team operates through their different tasks. In order for us to properly improve their processes, I suggested we map out their process today to understand their day-to-day tasks and data management.
The goal by doing this is to identify the main scenarios the team works through and break down the touch points into a streamline view for reference. By doing this, it will give a visual explanation of the processes today, locate where and how things can be altered, and determine an ideal flow as we look to improve the teams workflow.

This exercise is set up to run through each of the businesses tasks and mark which team member is involved at what point using the colored circles with their initials. I presented a starting list of questions to the user to help start their thoughts and truly engage in the exercise.
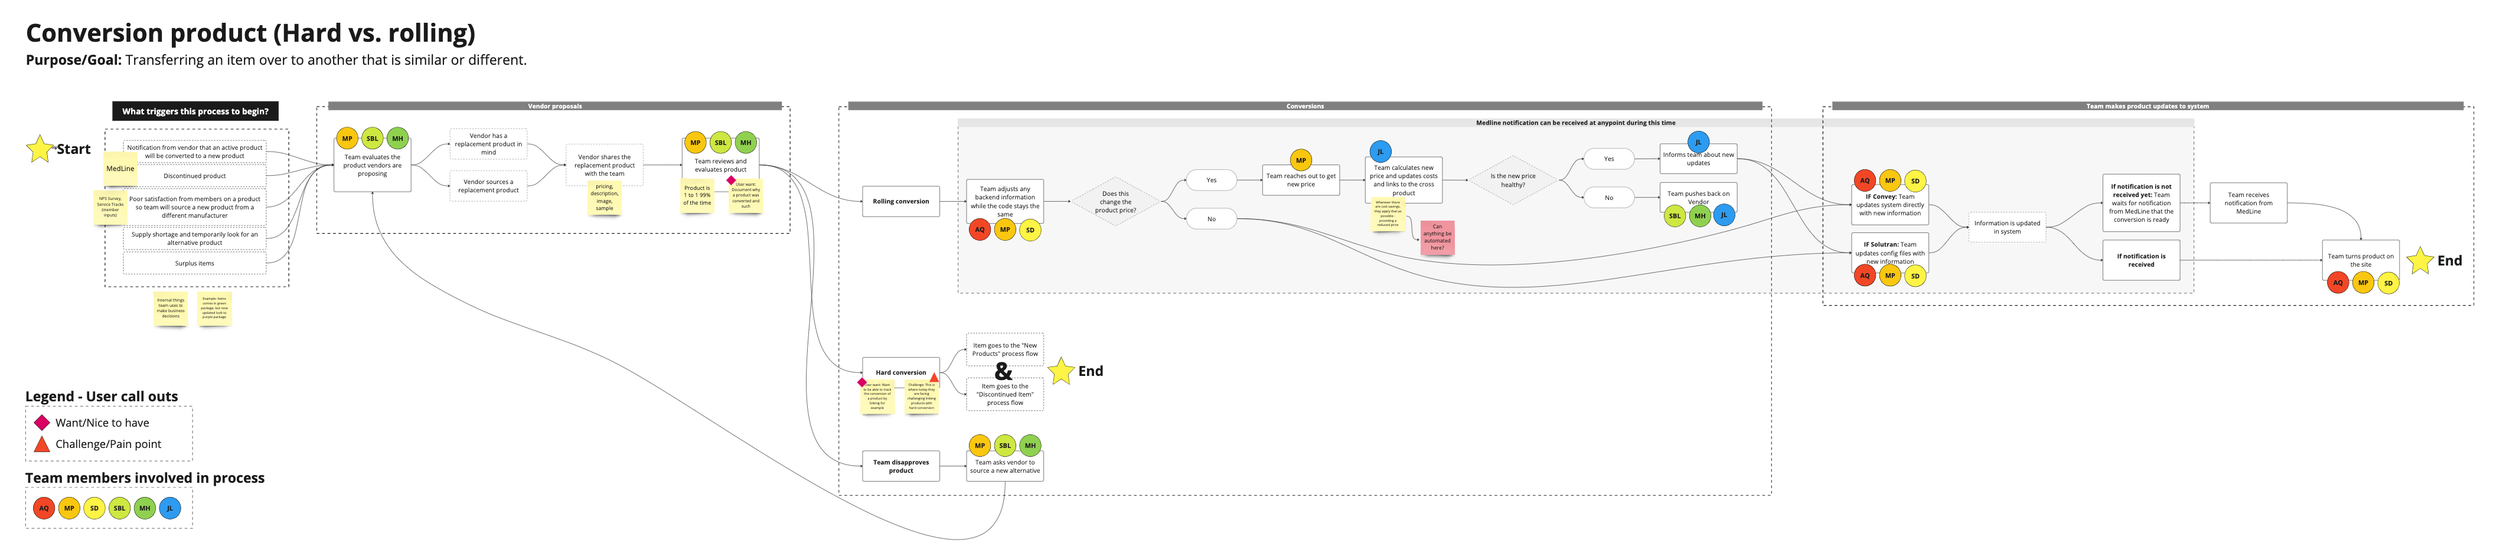
This is an example of one of the work scenarios I mapped to follows the team’s process today. Each map identifies the scenario, the purpose/goal of the scenario, and describes how the scenario is triggered through the completion of the task. In addition to marking who is involved where, I’ve noted where pain points and wants exist.
Step 3
Establishing metrics
As I am gathering intel and leading the research exercises I am continually updating my user challenges and user wants list. In addition, I’ve recognized things users mention during calls and connected pieces within my notes that there are many opportunities measure and compare in the future to learn if and how improvements are being made for the end-users and for the overall company.
This running list is formulated based on known issues, ideal wants, and basic user measurements. My approach to considering these specific metrics is to learn how the experience is being improved over time and also how the experience will benefit the company financially.

This is my running list of possible things to measure overtime.
Step 4
File breakdown exercise
I am currently setting up another exercise to better understand each of the excel files the team uses to today to know how to apply and work them into their custom PLM. Currently the team manages 13 excel files to track their products in and create forecasts that all interact with each other. Like the process flows, nothing is written down to identify where and how things are connected. I structured an exercise to gather information about each file:
Summary/Purpose of the file
Who works in the file
Main actions taken in the file
What informs the data in the file, where are they getting their information
What other files does this file inform
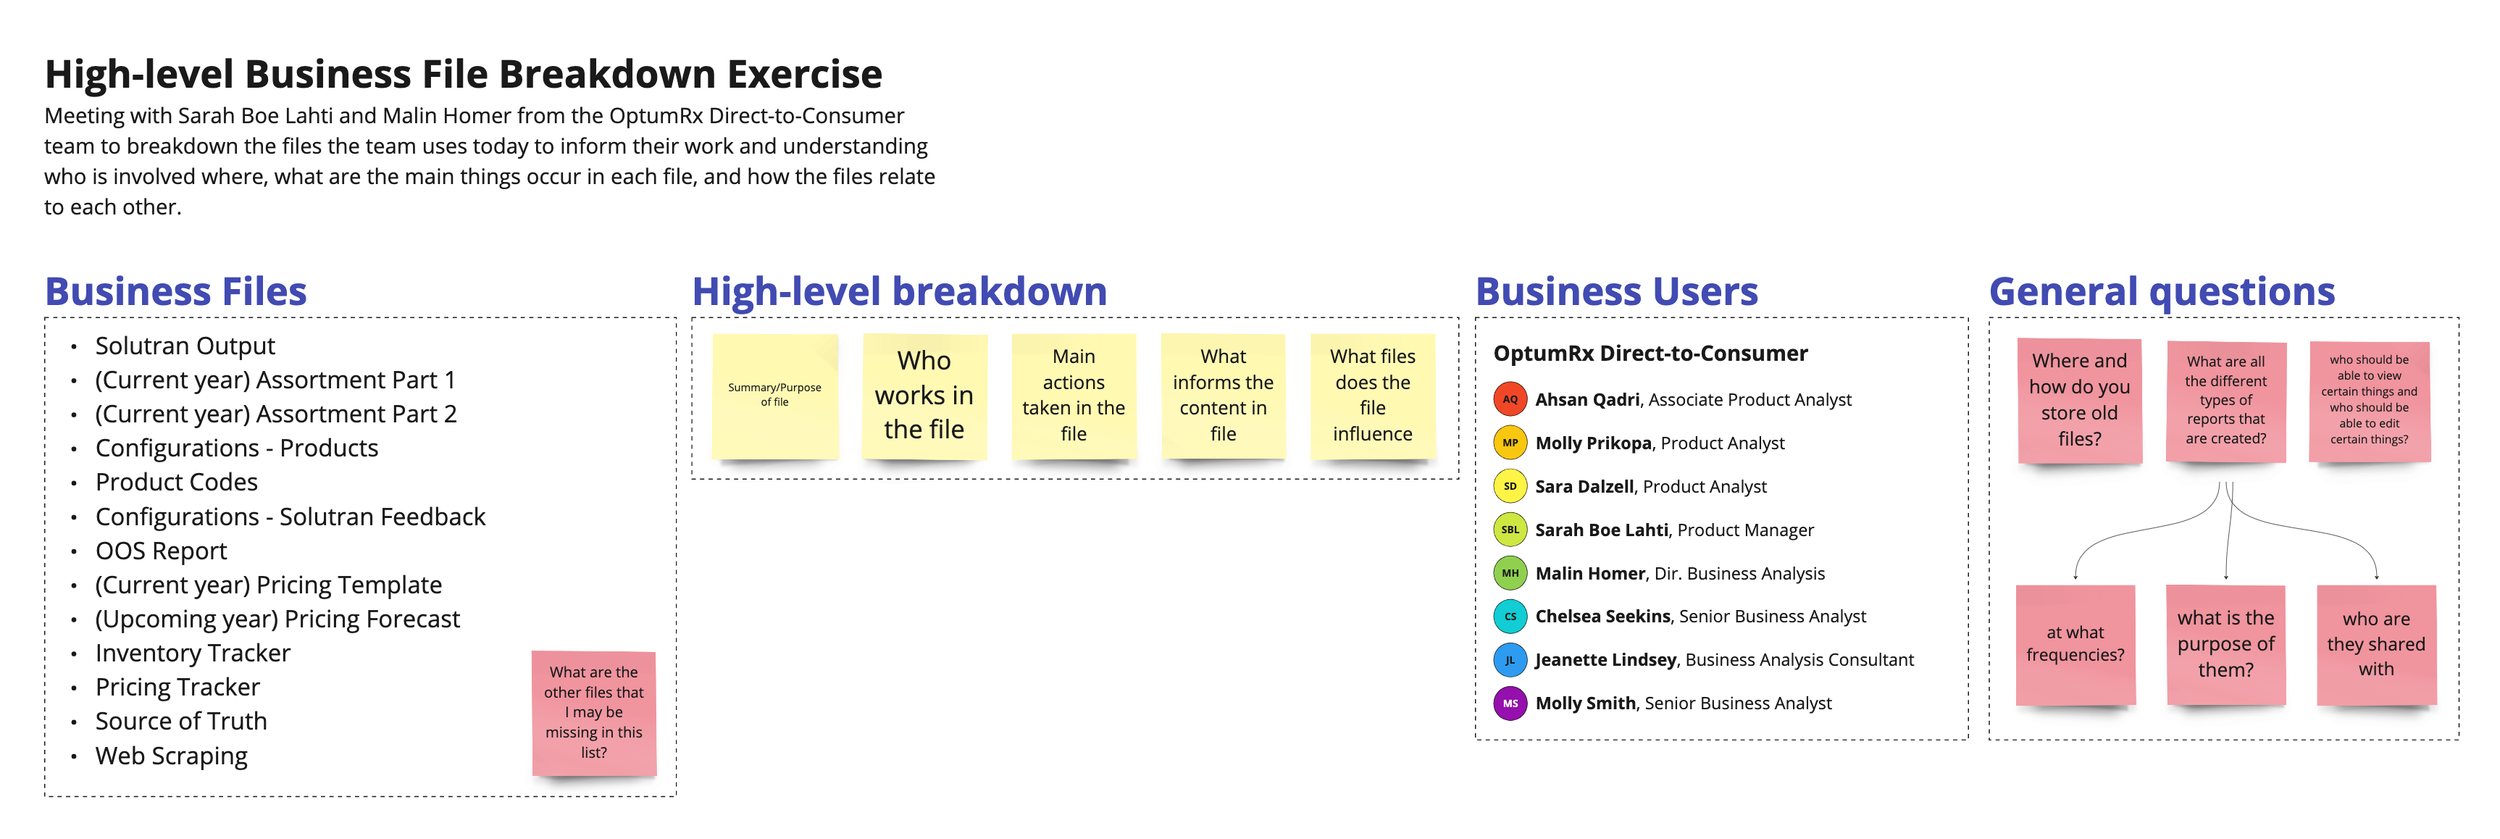
This is how I prepared the exercise to be presented and explained to the team to best gather information on each file and how it is used.
Step 5
Crafting user personas
From the various user sessions, the notes and information I gather from that, conversing and asking questions to dig deep into the users experiences, frustrations, and wants, I am able to begin drafting user personas. I am noticing there are about 3 types of personas: A Pricing & Forecaster, Data Admin, and an Overseer/Manager of some-type. In creating personas, I am marking the following elements
Who - which team members fall in this category
Typical activities
Which files they interact with
What are their goals
What are their biggest challenges
What is their current work satisfaction rating (I’ll use this metric to compare in the future once their PLM is built to measure improvements)
This is how I’ve set this project up so far and am enjoying every second of it!
Upcoming items include, determine scope with team, designing site maps, and designs UI visuals!